
System Integration and Business Analysis is a showroom for machine learning in action. Here you find neural networks in context of time series for the purpose of forecasting and decision support. Better forecasts promise better decisions to increase sales and reduce costs.
Time Series
For illustration purposes take historical demands for an arbitrary product. If you know upcoming demands you can plan accordingly (for instance, stock amount and production capacity). The better the forecast, the more accurate the planning.
Machine Learning
Please enter TSMLTC (Time Series Machine Learning Test Center) here.
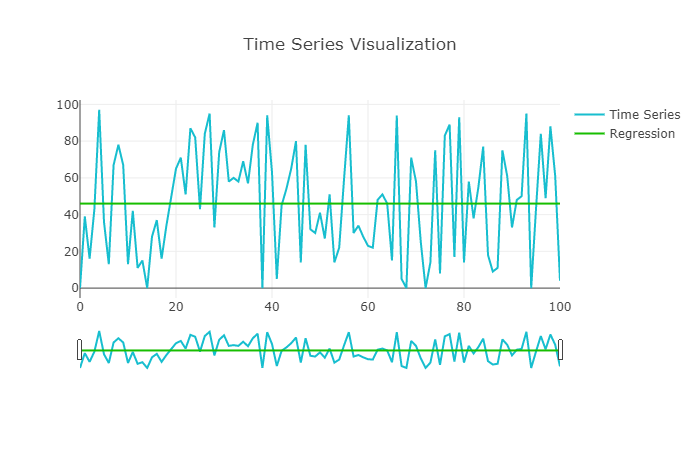
Provided are services for creating and maintaining arbitrary time series for testing purposes. For each series you can calculate a regression along with its quadratic deviation from the series as well as a forecast for the next point in time.
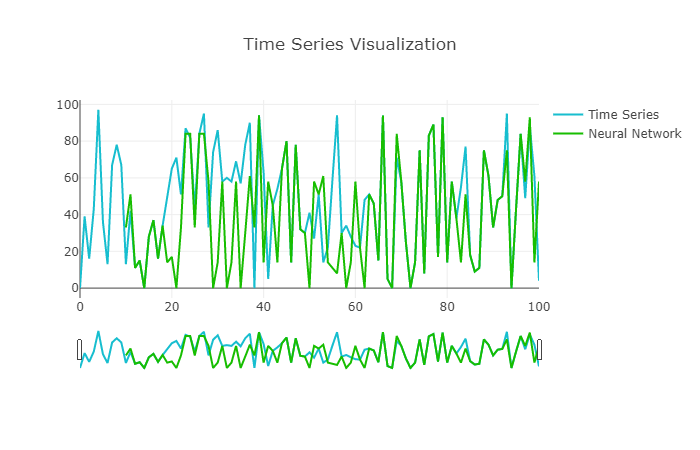
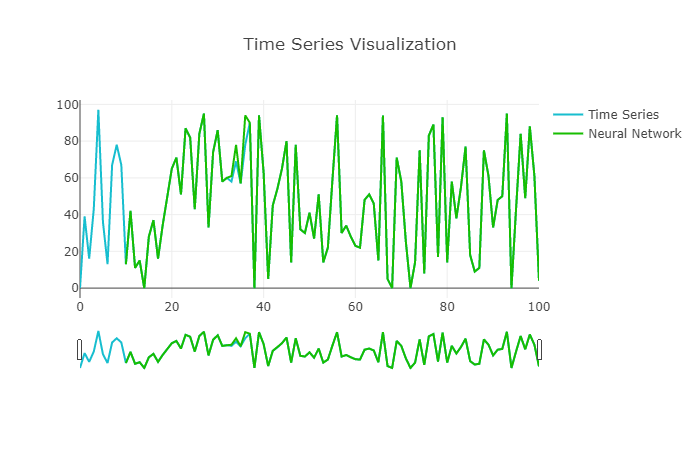
Moreover, you can configure and execute training of a neural network. Learning rate, training iterations and size of training data determine training results. Finally, quadratic deviation from the series and forecast of the next point in time are generated for performance comparison.
Tools
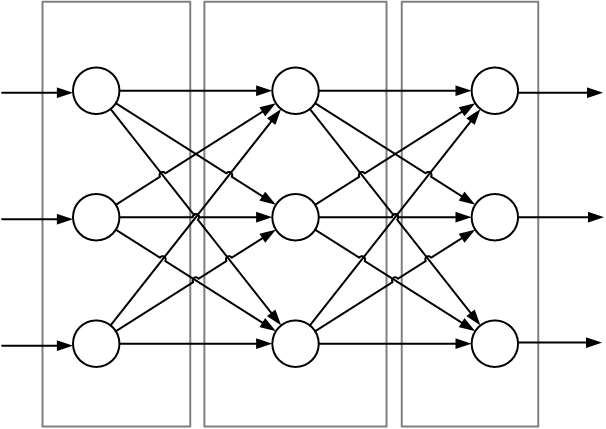
The neural network was written in JAVA without any use of machine learning libraries. Feed forward, error calculation, back propagation, weight updates, and all necessary matrix operations were put down from scratch. You can find the source code published under GPL here.
TSMLTC was developed with Angular (Type Script), Spring Boot (Java), Hibernate/JPA (object-relational mapping), PostgreSQL (relational database) and Apache Kafka (Messaging). Access to neural network and regression analysis is accomplished via REST interface and Apache Kafka. Time series, regression values and network forecasts are visualized graphically with plotly (Java Script).
Author